1. What are sharks?
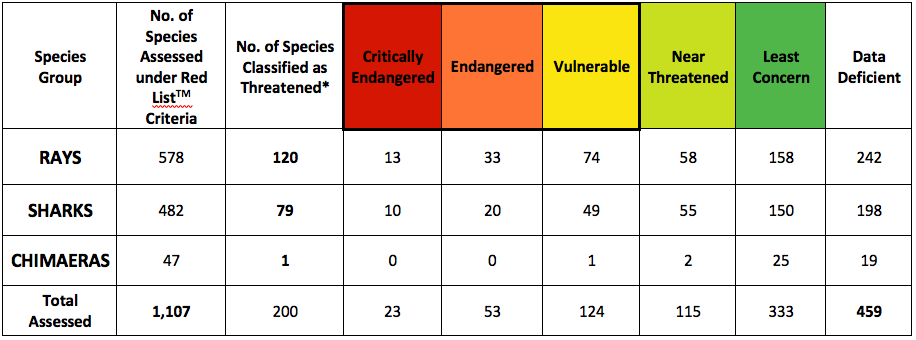
There are 1,107 described Chondrichthyan species around the world - this includes sharks, rays, skates and chimaeras. Of those species, there are 432 species of sharks. A new species of chondrichthyan is discovered every two weeks on average.
Many reports (for example, reports written by our organisation) use the term sharks to mean all Chondricthyan species - we define this at the beginning of our reports, whereas others talk about sharks as just being the sharks (Elasmobranchs). Chondrichthyes are Chimariformes (chimaeras) + elasmobranchii (elasmobranchs) + batoideia (batoids). Elasmobranchs are largely sharks and batoids are largely rays, but also include guitarfishes, sawfishes and coldwater skates. It is important to note that it is not just sharks that are targeted by fisheries for meat or for fins - rays are increasingly becoming targets of these fisheries.
Many reports (for example, reports written by our organisation) use the term sharks to mean all Chondricthyan species - we define this at the beginning of our reports, whereas others talk about sharks as just being the sharks (Elasmobranchs). Chondrichthyes are Chimariformes (chimaeras) + elasmobranchii (elasmobranchs) + batoideia (batoids). Elasmobranchs are largely sharks and batoids are largely rays, but also include guitarfishes, sawfishes and coldwater skates. It is important to note that it is not just sharks that are targeted by fisheries for meat or for fins - rays are increasingly becoming targets of these fisheries.
2. Which species of shark are targeted for their fins?
Targeting is a difficult concept. Most sharks and rays are caught alongside fishing operations for other fish species, or are caught in indiscriminate fishing gears (longlines, trawls). So most species are bycatch, but often a valuable bycatch. The reasons sharks decline is that they are more sensitive to fishing than the species that are targeted. Hence it is inevitable that sharks decline even if the target species is sustainably fished. It is hard to say which species are taken by the finning industry - there are some scientific papers that have carried out surveys (genetic or market surveys) that have looked at species for sale but this has only been in certain markets in certain areas of the world.
3. Have any species of shark become extinct because of fishing?
No shark species, to our knowledge, have become extinct globally due to industrial scale fishing. However, there are some populations of species that have become locally extinct, for example see Dulvy et al. 2003; Dulvy and Forrest 2009; Dulvy et al. 2014.
4. How do the IUCN Categories and Criteria work?
The IUCN Red List Categories and Criteria are used widely as an objective and authoritative system for assessing the global risk of extinction for species. They have undergone an extensive review since their first use and the currently used system, IUCN Red List Categories and Criteria version 3.1., were adopted by IUCN Council in February 2000. Under this system, information on geographic range, life-history, population trend, size and structure, threats and conservation measures, is used to evaluate each species against the IUCN Red List criteria and assign it to one of eight Red List categories.
There are three threatened categories: Critically Endangered, Endangered and Vulnerable (collectively referred to as the 'threatened' categories). Species that do not meet the threshold for a threatened category, but are close to qualifying or are likely to qualify for a threatened category in the near future are placed into the Near Threatened category. Species that have been evaluated against the Red List criteria and do not qualify for either a threatened category or Near Threatened are assessed as Least Concern. A species is Data Deficient when there is inadequate information to make a direct or indirect assessment of its risk of extinction using the Red List criteria. The category ‘Not Evaluated’ indicates that a species has not yet been evaluated against the criteria. See the IUCN Red List Categories and Criteria for further information.
Nearly half of all chondrichthyan species are Data Deficient, which means that we do not have enough information on them to assign a category. Estimates have been made as to the number of Data Deficient species that may be threatened with extinction, and as of 2014 of the 487 species that are listed as Data Deficient, 66 are likely threatened (Dulvy et al. 2014). For more information view our Extinction Risk & Conservation of the World's Sharks and Rays Fast Facts. An updated list of Red List Categories for rays, sharks, and chimaeras can be found here.

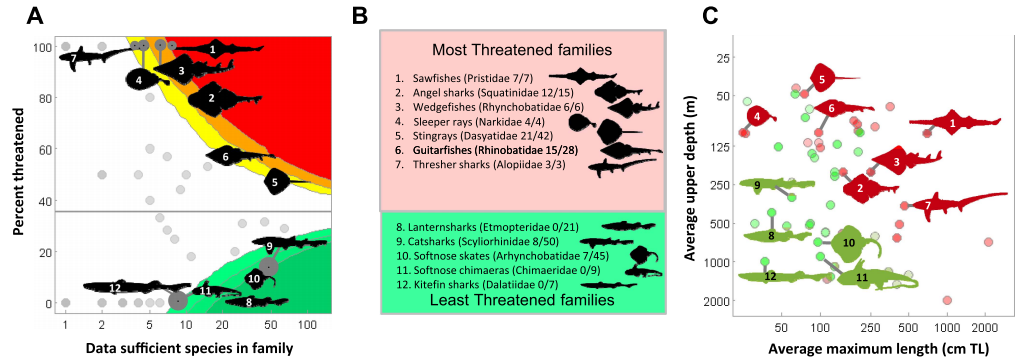
(A) Proportion of threatened data sufficient species and the richness of each taxonomic family; (B) The most and least threatened taxonomic families; (C) Average life history sensitivity and accessibility to fisheries of 56 chondrichthyan families. Significantly greater (or lower) risk than expected is shown in red (green). Source: Dulvy et al. 2014
5. How many sharks are killed each year?
Tonnage
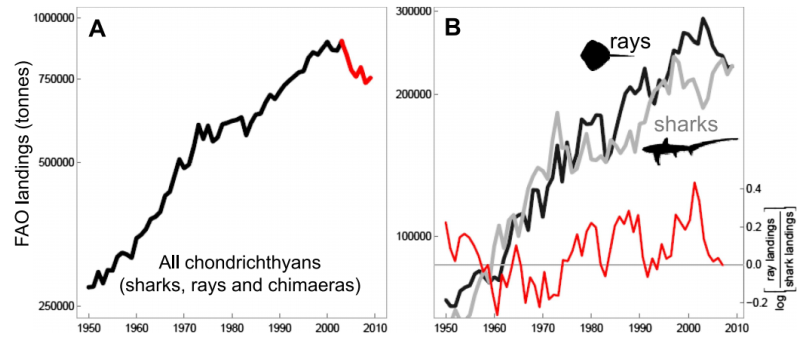
Globally, shark catch has been declining since a peak of over 900,000 tonnes/yr in 2003 (FAO 2008). However, these data represent when animals are caught and brought to shore ("landed") and they do not account for illegal catches or discards. In many instances, the fins of sharks and rays are removed and retained and the carcass is discarded. The number of shark and ray landings increased by 227% from 1950 to 2003, and showed a small decline of 15% in 2011. This decline from 2003 to 2011 is likely a result of fishing pressure and ecosystem attributes, rather than from management measures (Davidson et al. 2015).
Globally, shark catch has been declining since a peak of over 900,000 tonnes/yr in 2003 (FAO 2008). However, these data represent when animals are caught and brought to shore ("landed") and they do not account for illegal catches or discards. In many instances, the fins of sharks and rays are removed and retained and the carcass is discarded. The number of shark and ray landings increased by 227% from 1950 to 2003, and showed a small decline of 15% in 2011. This decline from 2003 to 2011 is likely a result of fishing pressure and ecosystem attributes, rather than from management measures (Davidson et al. 2015).

(A) The landed catch of chondrichthyans reported to the Food and Agriculture Organization of the United Nations from 1950 to 2009 up to the peak in 2003 (black) and subsequent decline (red). (B) The rising contribution of rays to the taxonomically-differentiated global reported landed catch: shark landings (light gray), ray landings (black), log ratio [rays/sharks], (red) Source: Dulvy et al. 2014
The Food and Agriculture Organization of the United Nations (FAO) reports that from 2000 to 2011, the total annual global shark fin imports were valued at USD377.9 million, with an average annual volume imported of 16,815 tonnes (Dent and Clark 2015). However, an analysis of the trade flow of shark fins through the Hong Kong fish markets suggests that somewhere between 26 to 73 million sharks (median of 38 million sharks) are traded annually worldwide (Clarke et al. 2006), significantly more than these FAO data.
An expanding market for shark meat also poses a serious threat to sharks and rays. FAO reported that 121,641 tonnes (USD379.8 million) of chondrichthyan meat was imported in 2011, representing a 42% increase by volume compared with 2000 (Dent and Clark 2015).
# of Animals:
The number of chondrichthyans killed per year has been estimated at 100 million animals. This figure has been around since the 1980s. A more recent update changes this little, though suggests a range of 63 to 273 million animals.
This figure is generally arrived at by taking the global weight of shark catch and dividing it by the average size of a caught shark. This is exactly how it was done in the 1980s, but this more recent estimate tries to break the catch into species and apply an average caught size for each species. We think this estimate is a vast underestimate, for a number of reasons: (1) it largely overlooks rays (which make up over half of the global catch in weight), (2) the global catch is a small fraction (1/2 to 1/4) of what we think is caught and doesn't enter markets, e.g. due to discarding or due to capture for local consumption.
Finally, we are concerned that the 100 million figure distracts from the real question, which is which sharks and rays are threatend with extinction due to overfishing. It is not the number caught, but the rate at which each species is caught relative to the productivity of that species. (Analogous to one earning rate and spending rate, the absolute amount spent tells you little about whether a person is going bankrupt. If you are wealthy, then most spending rates are sustainable; if you are poor then anything but the lowest spending rate is hard to sustain.) Sharks have a wide range of life histories and some are among the slowest life histories on the planet. Indeed, Spiny Dogfish has among the longest pregnancy (24 months) and the Greenland shark matures at 150 years.
If you want to know more about which sharks are at risk: http://www.iucnssg.org/global-conservation-status-of-sharks-and-rays.html
If you want to know about new evidence on sustainable shark fisheries: http://www.dulvy.com/sharkbrightspots.html
6. Why does the IUCN Red List and the IPBEs report report that 31% of sharks and rays are threatened?
IUCN calculates percent threatened by assuming the Data Deficient (DD) species are threatened at the same rate as the data-sufficient species: https://www.iucnredlist.org/resources/summary-statistics. The key assumption is that the DD species have the same traits and exposure to fishing as the non-DD. Over 40% of sharks and rays are Data Deficient. This assumption is not borne out, this is why the eLife paper reports a lower threat level, 24%, because we account for traits when predicting status of DDs in that paper. The IUCN approach is most useful for making comparisons across a wide range of species, as is reported in figure 3A of the recent IPBES Summary for Policy makers: https://www.ipbes.net/news/ipbes-global-assessment-summary-policymakers-pdf
Davidson, L.N.K., Krawchuk, M.A. and Dulvy, N.K. 2015. Why have global shark and ray landings declined: improved management or overfishing? Fish and Fisheries doi: 10.1111/faf.12119.
Dent, F. and Clarke, S. 2015. State of the global market for shark products. FAO Fisheries and Aquaculture Technical Paper No. 590. Rome, FAO. 187 pp.
Dulvy, N.K. et al. 2014. Extinction risk and conservation of the world's sharks and rays. eLife 2014;3:e00590.
FAO. 2014. The State of World Fisheries and Aquaculture 2014. Rome. 223 pp.
FAO. 2008. The State of World Fisheries and Aquaculture 2008. Rome. 176 pp.
Clarke, S.C., McAllister, M.K., Milner-Gulland, E.J., Kirkwood, G.P., Michielsens, C.G.J., Agnew, D.J., Pikitch, E.K., Nakano, H. and Shivji, M.S. 2006. Global estimates of shark catches using trade records from commercial markets. Ecology Letters 9:1115-1126.


